


.svg)


Angular advertises that their framework is "batteries included." This is primarily true, until you get started setting up the development environment.
Whether you’re an Angular Developer, Angular Consultant, Angular employee, or even an Angular expert, you need a way to increase your code quality and speed up delivery. You need our top 5 must-have tools for Angular debugging!
1. Angular Generator
The Angular Generator is one of many modules that are part of the Angular CLI. The Angular Generator takes the guesswork out of building different elements of the Angular framework. One of the biggest mistakes a new Angular developer can make is not using the generator. Copy pasting from file to file is bound to leave something out, especially when dealing with advanced tools like NGRX.
There's a variety of conventions baked into the generator that ensures Angular developers, senior and junior alike, adhere to. Using the generator to build a component ensures the file name is dashed case (my-table.component.ts), and the component name is upper camel case (MyTableComponent).
Pair this with the Visual Studio Code extension NX Console to provide a more graphical way of generating code, which is especially useful for lesser-known commands.
How to Use Angular Generator
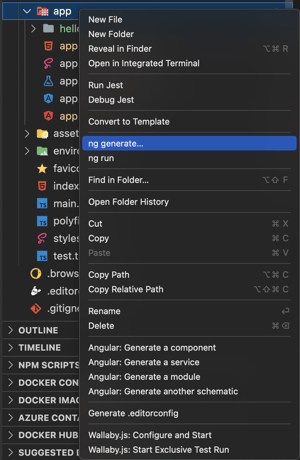
After right-clicking on a folder, select Angular: Generate a component, and a new tab appears with every possible argument. This is an excellent way for Angular Developers to discover knowledge on lesser-used arguments and flags.
With Angular version 14, the Angular CLI is more feature-rich than ever. There are a bevy of features, from standardizing the CLI arguments to better code completion—including new ng analytics and ng cache. Check out this blog post for more details on Angular CLI version 14 improvements.
2. Angular Command Tool
Does the following scenario sound familiar? While waiting for the backend API development to complete, an Angular developer starts building out the frontend using some mock data. To test the methods, the developer adds buttons to a component. Next, each button gets its own (click) event binding to step through the code.
Enter Angular Command Tool, the best way to trigger methods in Angular without filling a page with buttons. The Angular Command Tool is on the browser's window object and provides a swiss-army knife of utilities to make debugging easier. The Angular Command Tool is sure to blow the socks off even seasoned Angular 2 and AngularJS consultants.
How to Use Angular Command Tool
To follow along, check out this Stackblitz: https://angular-ivy-oayjk2.stackblitz.io/
Open the browser's developer tools (often F12) and click on the component in the elements pane seen below:
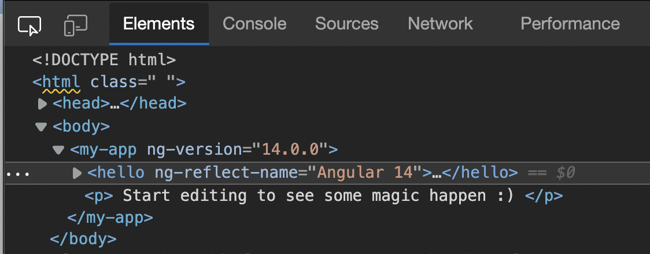
In the command line (control + `), enter the following command explained below:
> ng.getComponent($0)-
Ngis the entry point to the Angular Command Tools, the gateway to saving Angular developers time. -
getComponentis a method which takes a reference to an Angular component (in this case$0) and returns the actual Angular component. Often, an Angular consultant deals with an existing codebase and has to find the fastest way to check a method; using the ng debugging object is the perfect solution. -
$0is a handy shortcut within chrome (or chrome-based) browsers that refers to the dom node currently selected in the Elements pane. As a side note,$1to$4are the nodes previously selected, with$0being current,$1being the node selected prior, etc.
Now, when hitting enter, the console should resemble the following:
This isn't that exciting by itself, but if we wanted to do some quick checks for the
sum
and
mult
methods, we could do some rapid tests seen below:
There's a lot more to check out within the Angular Command Tools, like how to trigger change detection manually. For more details, check out the documentation at Angular Command Tools.
3. Visual Studio Code Debugger
Many Angular developers live and breathe the Google Chrome (or chrome-based) developer tools. However, constantly alt + tabbing between vs code and the developer tools can take unnecessary time. This is especially time consuming when the developer mistakenly starts making changes in the Chrome developer window instead of the VS Code editor, only to refresh and lose all those changes.
VS Code can use its native debugger so developers can step through their Angular code in the same place they're developing.
How to Use VS Code Debugger
Open up an Angular project in VS Code and open the debugger pane.
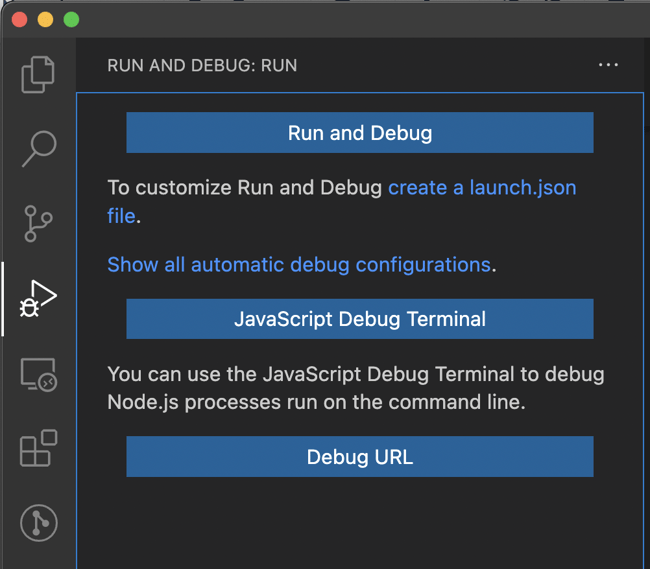
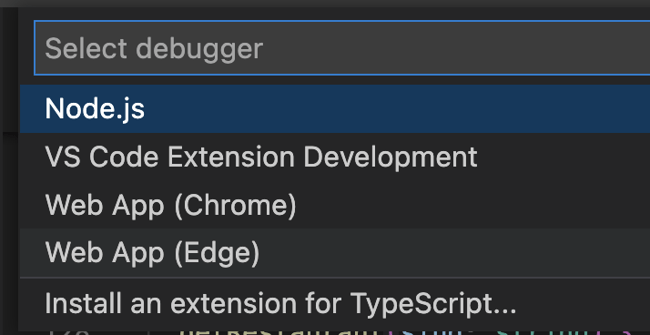
Click “create a launch.json file” and select the Web App (Edge); unless a bloated browser is preferred, there's an option for Web App (Chrome)
Next, set a configuration that is more in line with Angular conventions:
{
  "name": "Launch Edge",
  "request": "launch",
  "type": "msedge",
  "url": "http://localhost:4200",
  "webRoot": "${workspaceFolder}",
  "preLaunchTask": "npm: start"
},
Now when launching Microsoft Edge, a breakpoint in VS Code should work.
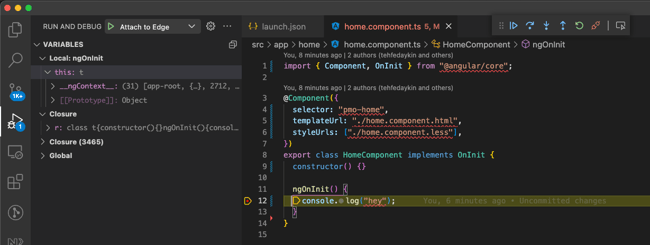
Complete with its very own console:
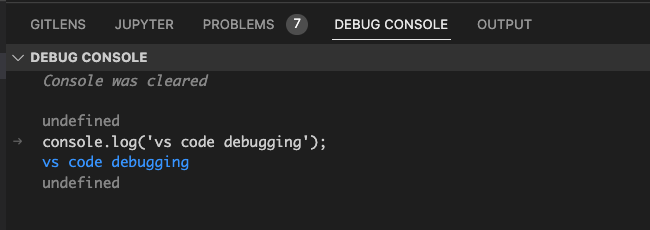
As an Angular Developer, the source code has to be front and center. Having VS Code debugging saves precious screen real estate from being taken up by the Chrome Dev Tools.
The other significant advantage is if someone's a coveted Full Stack Developer working with Angular and server-side code, VS Code provides a standard UI for debugging frontend and backend code. For more details about setting up VS code debugging, check our their documentation.
4. Angular Developer Browser Extension
Tracking down an extra change detection cycle can be tedious and often involves many console.log, which may or may not be overly console-ing. AngularJS Consultants or employees might remember ‘Batarang’—Angular Developer Browser Extension is the same idea, but it’s a total overhaul for modern Angular. Ditch the console.log and use the best tool for the job. Angular Developer Browser Extensions work in modern browsers and provide insight into components and their lifecycles.

Regarding out-of-control methods or slow Angular apps, the Profiler is a great way to start narrowing down where the issue is. The components tab answers the all-important question of where the data is coming and going.
Visit the extension's page to check out more details about the Angular Developer Browser Extension.
5. Bitovi
Angular is moving forward at a continuously faster and faster pace. The number of tools, libraries, and best practices is ever-changing, so why not hire the Angular experts at Bitovi?
Living, breathing, and of course dreaming in Angular is one of Bitovi's many superpowers. We have a staff of experts pouring over the release notes and GitHub issues, writing blogs, and delivering talks about Angular best practices so our clients can focus on delivering the products they know best.
Whether you’re fine-tuning a business-critical application, scaling up new developers, or establishing best practices, Bitovi is there to help our clients realize their goals with our Angular Consulting Services.
Let Bitovi upgrade your experience.
Previous Post